24. Uptime
This document covers how to use the Hub 2.0 Uptime module to monitor your website’s Uptime, Downtime, and Response Times.
If you haven’t set up your WPMU DEV account yet, visit the Hub page, where you can explore the features and see pricing packages.
Already a member? Visit your Hub dashboard to get started.
24.1 Getting Started
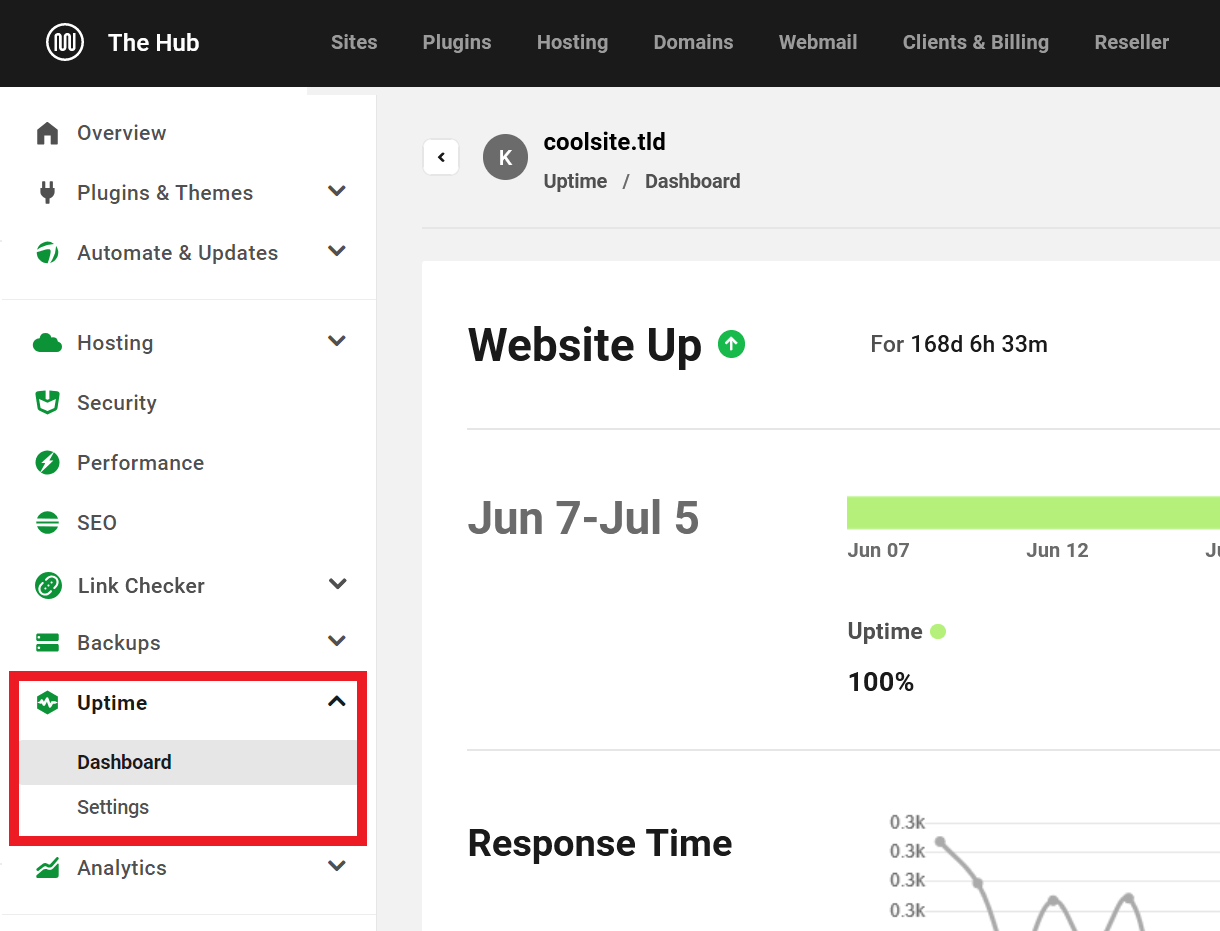
Copy chapter anchor to clipboardTo access the Uptime section for a site, from the Hub 2.0 My Sites page click on the site you would like to manage and click on the Uptime > Dashboard option in the site manager menu.
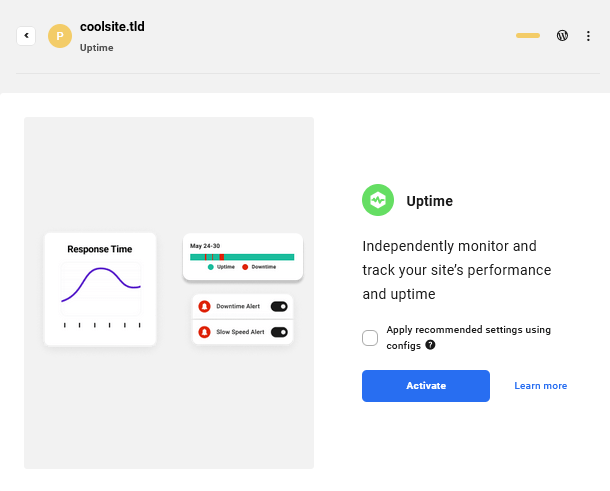
If you haven’t set up Uptime for your site, click the Activate button.
In Multisite networks, Uptime only reports data for the main site because subsites are always on the same server and share the same uptime data.
24.2 Uptime Dashboard
Copy chapter anchor to clipboardWebsite Up
This section notifies you if your site is Up or Down and how long it has been since your last Downtime.
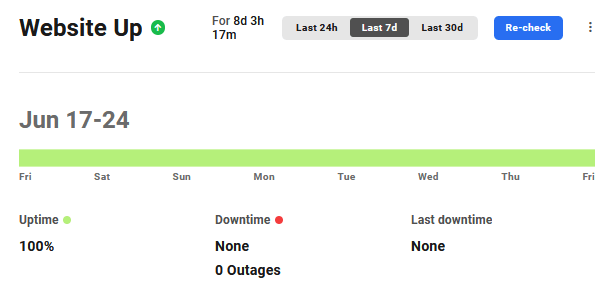
The toggles at the top enable you to see stats for the last 24 hours, 7 days, or the last 30 days.
The included graph shows:
- Uptime
- Downtime
- Last Downtime
Click the Re-Check button to refresh the Uptime data at any time.
Response Time
Uptime pings your site every 2 minutes from our server in Virginia, USA, and tracks TTFB in the Response Time graph (TTFB is the time it takes from when a client makes an HTTP request to it receiving its first byte of data from the webserver).
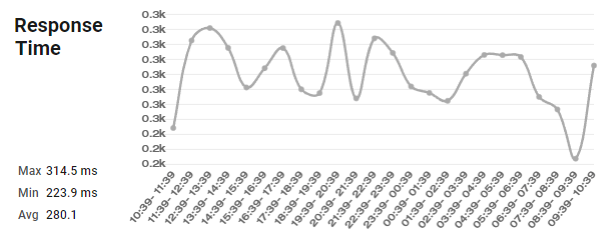
The response time graph shows the response time for the selected period. For example, if you choose to display the stats for the last 24 hours, the graph will show the response time for a one-hour interval on the x-axis.
If your site did not respond or your HomePage took more than 30 sec to load, it will log the downtime and send you a notice. If, on the other hand, everything works and loads normally but you are still getting Uptime notices, please check your server and/or plugin Firewall and add these 2 IP addresses to your allowlist: 34.196.51.17, 35.157.144.199.
For the full list of all WPMU DEV IP addresses you may need to allow in your firewall, see our WPMU DEV IP Addresses doc.
Note that the pings from Uptime are excluded from tracking data in your Hub and do not count as visits in the Analytics tracking section detailed below. Other tracking platforms may count the pings though, but they would be counted as a single visit per day as the IP is always the same.
You will also see max time, minimum time, and the average over the selected time.
Potential Cloudflare Issues
- If your domain is routed through Cloudflare with the firewall feature enabled there, add the WPMU DEV IP addresses to the allowlist in your Cloudflare Firewall.
- If your domain is routed through Cloudflare and you have a firewall enabled on your server as well, add WPMU DEV IP addresses to both firewalls. Your Cloudflare IP addresses should also be allowlisted on the server firewall to prevent any blockage.
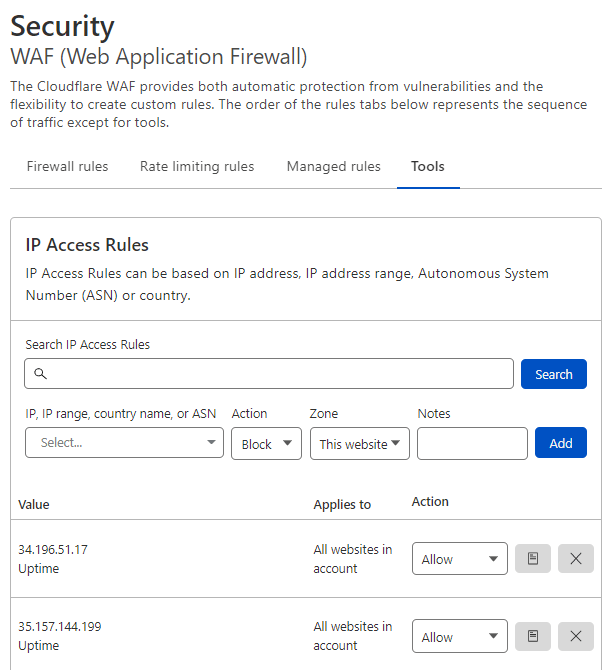
- If your domain is routed through Cloudflare and you have Bot Fight Mode enabled there, add the WPMU DEV IP addresses to the IP Access Rules section under Security > WAF > Tools.
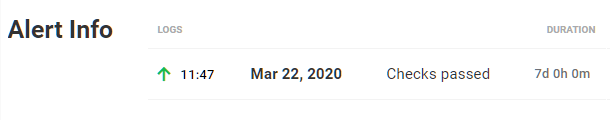
Alert Info
This section is a log of checks, when it was run, downtime, and duration of uptime.
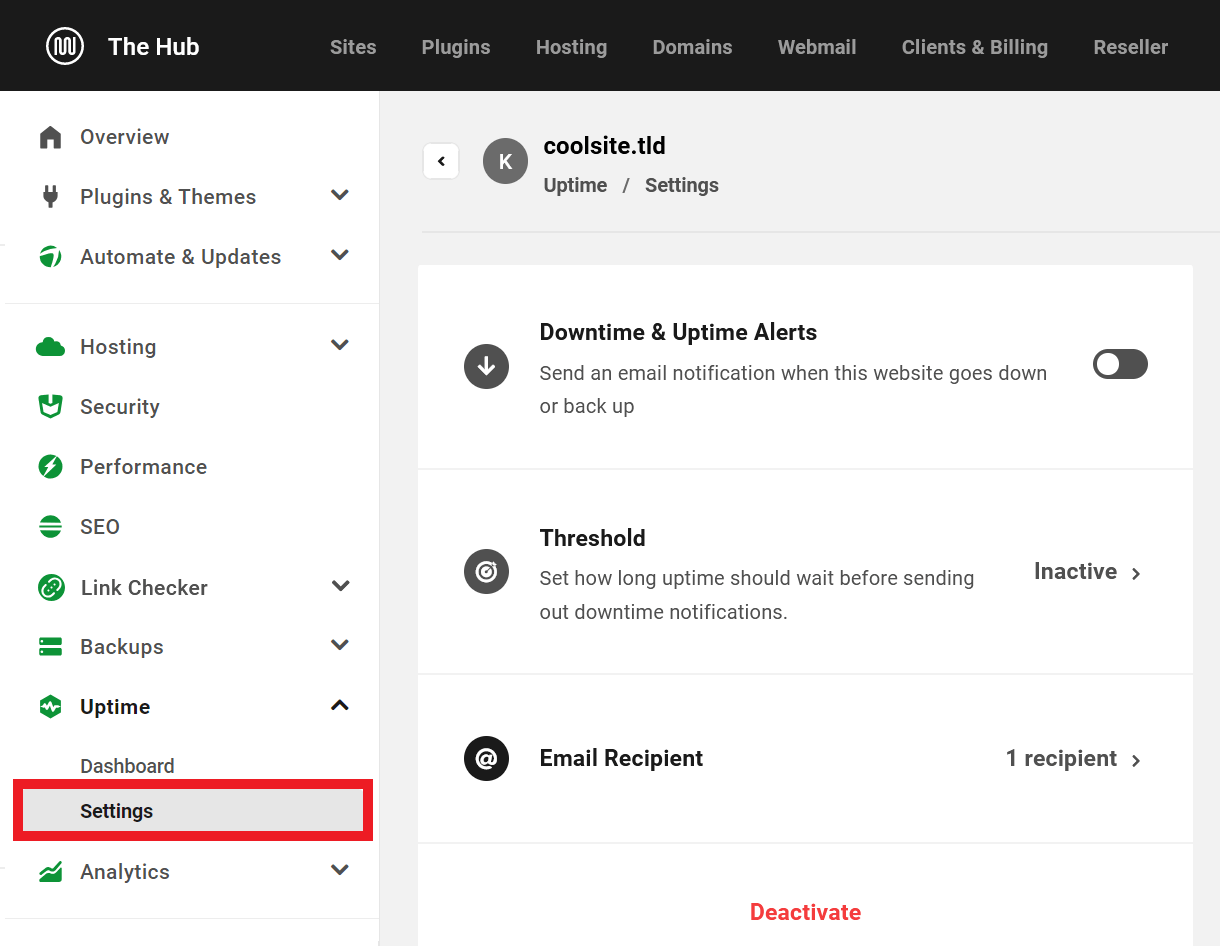
24.3 Uptime Settings
Copy chapter anchor to clipboardThe settings screen lets you configure your Uptime email notifications. Settings options include:
- Downtime & Uptime Alerts – Use the toggle to send an email notification when this website goes down or back up.
- Threshold – Set how long uptime should wait before sending out downtime notifications. Instant or after 5 minutes, 10 minutes, or 30 minutes. We won’t notify you if your website becomes available again within the set timeframe. For example, if your threshold is set to 10 minutes and your site goes down but becomes available again after only 8 minutes of downtime, you will not receive a notification.
- Email Recipient – This is where your Uptime reports are sent. By default, it is set to send to the email address associated with your WPMU DEV account, but you can change that and/or add other recipients. Note that both Name and Email address are required for each recipient, and uptime notifications will only be recieved once the email address is confirmed.
- Deactivate – Clicking the Deactivate button will disable Uptime on your website and turn off Uptime tracking in the Hub.
Note that if you are a free Hub user, you cannot set the Threshold to Instant, and you can add only one recipient. See Free Hub Restrictions for details.
Also note that if the Proactive monitoring service addon is currently active on your site, you will not be able to make any updates to the Uptime > Settings page.
When Uptime is activated for the first time, all the email notifications associated with Uptime will be sent to the email of the person who activated the service.
24.4 Uptime Configs
Copy chapter anchor to clipboardYou can save the current Uptime configuration of any site in your Hub, and apply it to any other site(s) in just a few clicks.
Note that when the uptime proactive monitoring add-on is active on a site, the Uptime configs (Default or Custom) can’t be saved or applied on that specific site.
Click the ellipsis icon in the Uptime widget on the Overview screen of your desired site, then click the Save Config option.
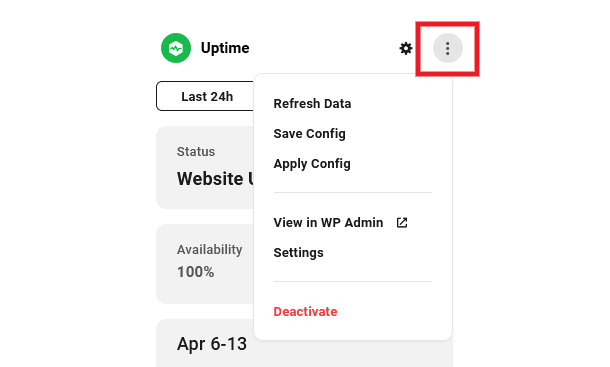
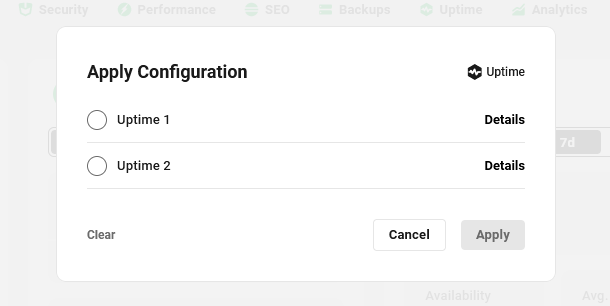
To apply any saved config to the current site, click the Apply Config option instead, then select the config you want to apply.
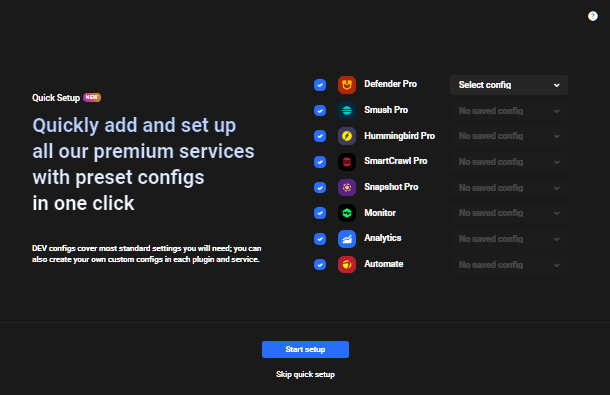
You can also apply any saved Uptime/Monitor config to any site using the Quick Setup feature while viewing that site in your Hub.
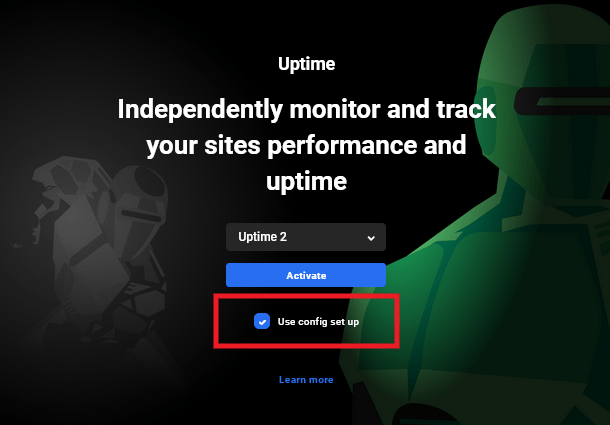
If Uptime is not yet active on a site, you can also apply a custom config directly from the Uptime Activate screen: Check the Use config set up box, then select the one you want to apply from the drop down menu that appears there.
For full details on creating and applying custom configs, please see the Configs documentation.
24.5 Downtime Issues
Copy chapter anchor to clipboardIf you are experiencing downtime and would like an indication of what the issue may be, below is a list of the status codes that you may encounter. Remember that should you need any assistance, we offer 24/7 live support.
- 100: ‘Continue’ – This status code informs you that the initial part of the request from the client has been received and that it has not been rejected by the server yet.
- 101: ‘Switching Protocols’ – The Switching Protocols code indicates that the server is switching to the protocol as requested by the client, in the message which includes an Upgrade request header.
- 201: ‘Created’ – The 201 status code confirms that the request has been successful and the new resource or resources have been created. This should be accompanied by a list of characteristics and location(s) of the entity.
- 202: ‘Accepted’ – This informs you that the request has been accepted but the processing is not yet complete. The processing may or may not complete.
- 203: ‘Non-Authoritative Information’ – The 203 status code indicates that the returned metainformation is not from the original server. The metainformation has been returned from a local or 3rd party copy.
- 204: ‘No content’ – The client’s request has been fulfilled by the server and does not need to return an entity-body. The primary intention for this is to allow for new inputs for actions, without changing the user agent’s active document view.
- 205: ‘Reset content’ – The Reset content status means that the document view should be reset by the user agent, as the server has fulfilled the request. This is primarily intended to allow a user to enter a new input action after the form has been cleared.
- 206: ‘Partial content’ – The 206 status code indicates that the server is completing a range request for the resource. It is doing this by transferring one or many of the parts of the representation that was selected, which correspond to the request’s Range header field.
- 300: ‘Multiple Choices’ – This means that the requested resource corresponds to any one of several resources. Typically, the response will include a list of resources with characteristics and location(s), from which the user agent or the user can choose one. The request will be redirected to the chosen resource.
- 303: ‘See Other’ – The return from the request can be found under a different URI. The server is redirecting the user agent to that different resource.
- 304: ‘Not Modified’ – The server should respond with this status code when a conditional GET request has been allowed but the document has not been modified. There is no need for the server to transfer a representation of the resource because the client already has a valid representation.
- 305: ‘Use Proxy’ – This is an indication that the resource must be requested via the proxy.
- 400: ‘Bad Request’ – The 400 status code means that there is malformed syntax in the request and it could not be understood by the server.
- 401: ‘Unauthorized’ – The Unauthorized status indicates that the request requires user authentication. This status code can also be presented, even with a suitable Authorization field header, due to incorrect credentials.
- 402: ‘Payment Required’ – This status code is simply reserved for future use. It was originally intended to be used in a digital cash scheme but that has not been implemented yet.
- 403: ‘Forbidden’ – The request has been understood by the server but it is refusing to fulfill it. Authorization will not help this status code.
- 404: ‘Not Found’ – This indicates that the Request-URI has not been found by the server or the server is not willing to acknowledge that one exists. There is no indication of whether this is temporary or permanent.
- 405: ‘Method Not Allowed’ – The 405 status code is presented when the method in the Request-Line is not allowed for the specific Request-URI.
- 406: ‘Not Acceptable’ – The Not Acceptable status means that, according to the proactive negotiation header fields, the target resource does not offer a representation that would currently be acceptable to the user agent.
- 407: ‘Proxy Authentication Required’ – This indicates that the client must authenticate itself with the proxy. The 407 status is similar to the 401 (Unauthorized) status code, but for proxy use.
- 408: ‘Request Timeout’ – The server was not prepared to wait longer for the client’s request.
- 409: ‘Conflict’ – This status code indicates that the request could not be completed because of a conflict with the resource’s state. The 409 code is used when it is expected that the user will be able to resolve the issue and resubmit the request.
- 410: ‘Gone’ – The 410 status is used when the resource is no longer available and there is no forwarding address for it. This condition is likely to be permanent.
- 411: ‘Length Required’ – The server will not accept the request without a defined Content-Length.
- 412: ‘Precondition Failed’ – The precondition in one or many of the request-header fields has been tested on the server and evaluated as false.
- 413: ‘Request Entity Too Large’ – This is used when the server is unable or not willing to process the request due to the request entity’s large size.
- 414: ‘Request-URI Too Long’ – The 414 condition is rare and is used when the server is not willing to action a Request-URI of that length. If this happens, look out for any improperly converted POST to GET requests, a redirected URI prefix that points to its own suffix or server attacks.
- 415: ‘Unsupported Media Type’ – The format of the request is not supported by the resource for the requested method. For this reason, the server is refusing to serve the request.
- 416: ‘Requested Range Not Satisfiable’ – The 416 status code indicates that the ranges in the request’s Range header field do not overlap with the selected resource. Alternatively, the requested ranges have been rejected because the range is invalid or there is an excessive request of small or overlapping ranges.
- 417: ‘Expectation Failed’ – This means that the server could not meet the expectation that was given in the Expect request-header field. Alternatively, if the server is a proxy, the request could not be met by the next-hop server.
- 429 – “Too many requests” – This indicates the user has sent too many requests in a given amount of time (See our Bruteforce Attack Protection doc for details).
- 500: ‘Internal Server Error’ – An unexpected condition was encountered by the server and the request could not be fulfilled.
- 501: ‘Not Implemented’ – This is used to indicate that the request cannot be fulfilled due to a lack of functionality support from the server.
- 502: ‘Bad Gateway’ – The Bad Gateway status occurs when the server is acting as a proxy or gateway. The server receives an invalid response from an upstream server that it accessed in an attempt to fulfill the request.
- 503: ‘Service Unavailable’ – This indicates that the server is overloaded or under maintenance and it is temporarily unable to handle the request.
- 504: ‘Gateway Timeout’ – The 504 status is used when the server is used as a gateway or proxy. The server tried to access an upstream server in an attempt to fulfill a request, but the server did not receive a timely response from the upstream server.
- 505: ‘HTTP Version Not Supported’ – This is used when the server does not or refuses to support the HTTP protocol version used in the request.
- 520: ‘HTTP status code is 520’ – This error is specific to CloudFlare and is a catch-all response when something unexpected happens or when the origin server incorrectly interprets or does not tolerate a request due to a protocol violation or an empty response. See possible causes and fixes in CloudFlare’s doc here.
- Error: connect ECONNREFUSED – This error indicates the server refused the Uptime ping. This can be due to a firewall blocking the connection, unopened port, unresponsive service, etc. If not related to a firewall or unopened ports, resolution of the issue usually requires a restart of services, which is automatically handled by most hosting providers if there are no other issues. Note that a restart of services could cause an additional delay, some downtime, and could trigger a connection timed out error.
- Error: getaddrinfo ENOTFOUND – This error indicates that Uptime cannot connect to the site because the domain can’t be found. The most common causes of this are improper DNS configuration or propagation delays, or an expired or suspended domain.
- Error: Internal: connection timed out – This error indicates your server took more than 30 seconds to respond, and the Uptime ping timed out. This can be due to very high traffic on the site, cron jobs consuming all resources, socket timeout, firewall settings, unresponsive server, etc.
If you change the domain (URL) that your site resolves to, the Uptime Monitor might still try to check the old domain that it was originally connected to, and return errors or report the site as down. To resolve this issue, simply deactivate Uptime on the site, then reactivate it so it connects to the domain currently associated with the site.
24.6 Uptime User Agent
Copy chapter anchor to clipboardIf you ever need to allowlist the user agent used by the Uptime Monitor in your robots.txt file or a firewall, it is called: WPMUDEV Uptime Monitor 5.0 (https://wpmudev.com)
24.7 Get Support
Copy chapter anchor to clipboardIf you still have questions or need assistance after reading this document, please don’t hesitate to contact our support superheroes using the available options under the Support tab in your Hub or via the Support tab in your WPMU DEV Dashboard.
